Introduction to Artificial Intelligence - Lab00 (5 pts.)
- Name:
- NETID:
This assignment covers the following topics:
- Loading Data into Dataframes
- Creating, Accessing, and Modifying Dataframes
- Uninformed Search
It will consist of 4 tasks:
| Task ID | Description | Points |
|---|---|---|
| 00 | Dataframe Loading, Modification, and Creation | |
| 00-1 | - Downloading Data from Github | 0 |
| 00-2 | - Loading a Dataframe from CSV | 0 |
| 00-3 | - Modifying Contents of a Dataframe | 1 |
| 00-4 | - Create a Num to Name Mapping Dataframe | 1 |
| 01 | Uninformed Search | |
| 01-1 | - Dijkstra's Algorithm | 1 |
| 02 | Path Reconstruction | |
| 02-1 | - Path Reconstruction Function | 0 |
| 02-2 | - Path Reconstruction Printing | 1 |
| 03 | Police Report Generation | |
| 03-1 | - Export to HTML | 0 |
Please complete all sections. Some questions may require written answers, while others may involve coding. Be sure to run your code cells to verify your solutions.
Story Progression
You and your partner head over to the police station to try and gather some evidence for the case. The Chief seems happy to see you and lets and slides the evidence folder across his desk. The first thing that you pull out is a map of Long Island and the surrounding areas. The map also has a number of travel options you could use, depending on the location you're in. There's taxis of course, but you could also take the train (public transport, who knew). Additionally, several locations have outgoing flights and even ferries you could take.
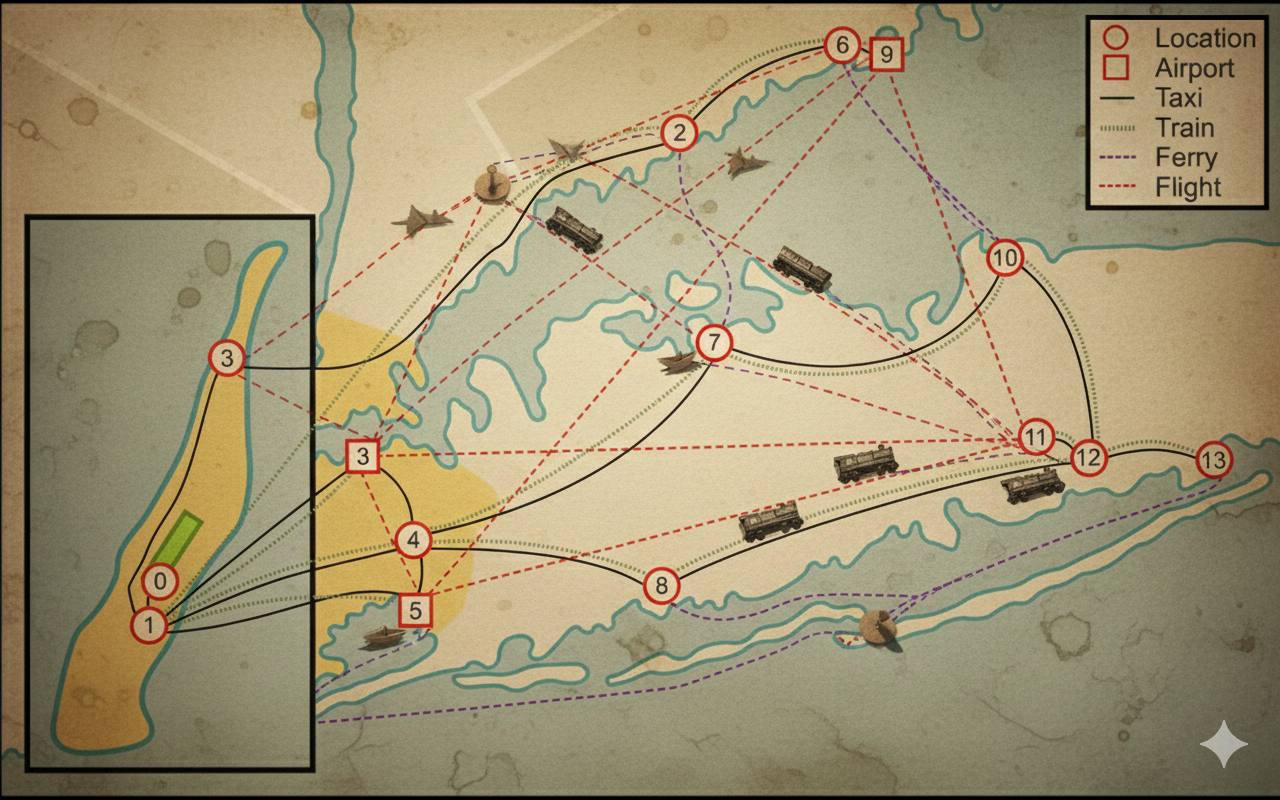
He tells you that before they'll fly you out to NYC, you need to submit a travel itinerary of the routes you'll take from Grand Central Station out to the Theisen-Floyd Estate. Unfortunately, due to budget cuts, you need to make sure you find the shortest route possible between the two, no sightseeing while you're out there on business. Thinking back to class, you reckon you could probably use some sort of shortest path algorithm, like Dijkstras to find the shortest path between Grand Central and the Estate. Luckily, after an absolutely staggering amount of painstaking research during his winter vaction to San Juan, the Chief has also collected geographically accurate travel times (in minutes) for each mode of travel, between each connected location, as an edge list.

Unfortunately, he stored this info as a CSV file on the police servers, so you'll need to download it and load it into your notebook.
Task 00: Data Loading
Task 00-1: Description (0 pts.)
Downloading Homework Data from Github
The first thing you should do is download the evidence that the Police currently have, which we can do using git. Running the code cell below will clone the repository containing the evidence, which we can then use in our code (this is if you're using colab, if you're running things locally you'll have to manage git yourself). Almost all of our assignments will have this code cell at the top.
Task 00-1: Code (0 pts.)
import os

try:
    import google.colab
    REPO_URL = "https://github.com/wtheisen/nd-cse-30124-homeworks.git"

    REPO_PATH = "/content/nd-cse-30124-homeworks"
    L_PATH = "nd-cse-30124-homeworks/evidence/lab00"

    %cd /content/
    !rm -r {REPO_PATH}

    # Clone repo
    if not os.path.exists(REPO_PATH):
        !git clone {REPO_URL}

        # cd into the data folder
        %cd {L_PATH}
        !pwd

except ImportError:
    print("Unable to download repo, either:")
    print("\tA.) You're not on colab")
    print("\tB.) It has already been cloned")
Task 00-2: Description (0 pts.)
Loading and Printing Dataframe
Now that we have the evidence files, we need to load them. The police have provided edges.csv which is an edge list representation of the map you've been given. The data has the following columns: src,dst,taxi_min,train_min,ferry_min,plane_min. Lets read these into a pandas dataframe and then print out the first five entries.
A pandas dataframe is a 2 dimensional data structure, like a 2 dimensional array, or a table with rows and columns.
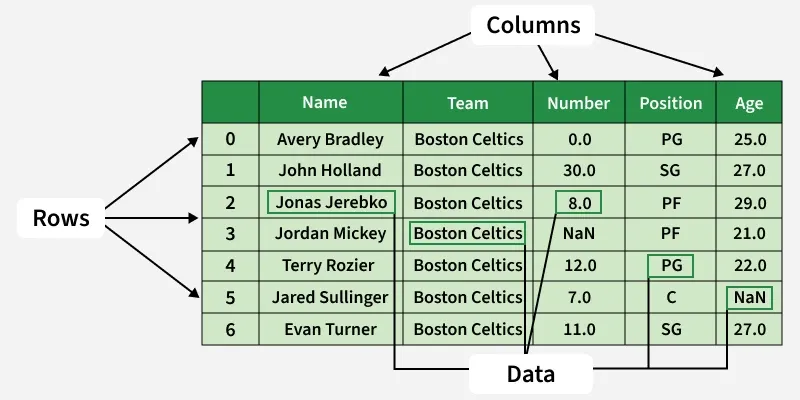
A lot of data science and AI work is done using dataframes to store the data, so it's worth becoming familiar with pandas. Luckily, pandas makes it very easy to load in CSV files, and we can use the following two functions to achieve our objective:
Lets call it edges_df.
Task 00-2: Code (0 pts.)
import pandas as pd # It's common practice to import pandas as pd

# TODO: Read edges.csv into a dataframe called edges_df using pd.read_csv()

# TODO: Print out the first five entries in our dataframe using df.head()
Task 00-2: Expected Output (0 pts.)
         src	dst	taxi_min	train_min	ferry_min	plane_min
0	0	  1	       8	       22	        0	        0
1	1	  2	      16	       48	        0	        0
2	1	  3	      63	       64	        0	        0
3	1	  4	      34	       43	        0 	        0
4	1	  9	      61	      100	        0	        0
Task 00-2: Supplementary (0 pts.)
If you look closely, you'll notice that pandas added an index column for us at the start of the dataframe. If we didn't want that to be added, we could set index_col=0 in pd.read_csv() as follows:
edges_df = pd.read_csv('edges.csv', index_col=0)
Task 00-3: Description (0 pts.)
Modifying Data in a Dataframe
Unfortunately, all of the numbers in our dataframe are read in as strings, since a CSV file is really just text. Lets modify our dataframe to cast all of the numbers from str to int. The simplest way to do this is to iterate over each column, which we can access using edges_df.columns. We can then cast each column as a whole to integers using astype(int).
To access a column in a dataframe, we need to "double index" the dataframe as they are stored as [rows, cols]: edges_df[[col]]
Task 00-3: Code (1 pt.)
# TODO: Iterate over each column of our dataframe using edges_df.columns and typecast the entire column to ints
Task 00-3: Supplementary (0 pts.)
While this works, this isn't quite the "proper" way to perform this. To make the most of the capabilities that pandas provides, we can use a function called select_dtypes() to find all columns that contain numbers, and run the following code:
Task 00-3: Supplementary Code (0 pts.)
int_cols = edges_df.select_dtypes(include="number").columns
edges_df[int_cols] = edges_df[int_cols].astype(int)
Story Progression
Unfortunately, it appears that all of the nodes on the map are just numbers, and it's pretty hard to tell where you should go just by the numbers. You reach back into the evidence folder and find a note mapping each number on the map to an actual name.

Using this note you could probably create something to map from the number to an actual name and that would make traveling a lot easier!
Task 00-4: Description (0 pts.)
Creating a Number to Name Mapping Dataframe
Using the data from Evidence 3 we need to create a Dataframe that will allow us to map from the numbers for the nodes on the map to their actual names, so that we have a nice path we can easily follow. In the cell below create a dataframe called num_to_name_df that contains the mapping from the number of the node to the name of the node. Make sure to use the column names from Evidence 3: node_id and name.
To create a dataframe, we can call pd.Dataframe() and pass in our data and column names as arguments. The call ends up looking like: pd.Dataframe(data, columns=["node_id","name"]). We will just need to make sure that our data is properly formatted when we pass it in.
Task 00-4: Code (0 pts.)
import pandas as pd

# TODO: Finish adding data from Evidence 3, following the format of the Central Park tuple
data = [
    (0, "Central Park"),
]

# TODO: Initialize num_to_name_df with the data and name the columns using pd.DataFrame()

# TODO: Print the first five entries in num_to_name_df
Task 00-4: Expected Output (1 pt.)
	node_id	name
0	0	Central Park
1	1	Grand Central Station
2	2	LGA
3	3	Norwalk
4	4	Jamaica
Task 00-4: Supplemental (0 pts.)
Again you'll notice that pandas added an index column for us, but we sort of already had one in the data. Unfortunately, the pd.DataFrame() constructor does not have the same index_col argument that we saw previously. What we can do instead is to tell pandas that we want to use the index column we already have in our data: node_id as the index column for this dataframe which we can do using df.set_index() as can be seen in the code cell below.
Task 00-4: Supplemental Code (0 pts.)
num_to_name_df.set_index('node_id', inplace=True)

num_to_name_df.head()
Task 00-4: Supplemental Expected Output (0 pts.)
	      name
node_id
0	Central Park
1	Grand Central Station
2	LGA
3	Norwalk
4	Jamaica
Story Progression
Now that we have all of the evidence in the right format, you can run Dijkstra's algorithm to create your travel itinerary!
Task 01: Dijkstra's Algorithm
Task 01-1: Description (0 pts.)
Dijkstra's Multipath Algorithm
In the cell below, write code for Dijkstra's with multiple edge types (each mode of travel between two given nodes). Dijkstra's uses a priority queue for the frontier. To do this in python we can use the heapq library. We can itialize our frontier using the following code:
priority_queue = []
heapq.heappush(priority_queue, (0, start))
To remove an item from our frontier we can use heapq.heappop(heap).
Additionally, you'll also need to access information from the evidence dataframes. One of the first things you may want to do is to iterate over all of the node numbers. Remember that we set the node_id column as our index column, so we can access those by calling df.index. This returns a pandas.Index but we can just iterate over it like we would a list or any other iterable.
Another thing you'll probably want to do in Dijkstra's is find all of the neighbors of the node you're currently at. We can do that by indexing our dataframe for rows where the src node is our current_vertex. This is easy in pandas because we can put a conditional in the square brackets of an access. The code below will return every row where the src index is the vertex we're currently at. Each row then contains the outgoing edges from our current vertex and then we can iterate over each dest in neighbors to find the index of each neighboring node.
neighbors = edges_df[edges_df["src"] == current_vertex]
Task 01-1: Code (1 pts.)
import heapq

def dijkstra_multi_mode(edges_df, start):
    """
    Dijkstra's algorithm with support for multiple transport modes.

    Args:
    - edges_df: DataFrame with columns [src, dst, taxi_min, train_min, ferry_min, plane_min].
    - start: Starting node number.

    Returns:
    - visited: Maps from node: (prev, total_cost)
    - nodes_visited: Count of how many nodes were visited.
    - edges_evaluated: Count of how many edges were evaluated.
    """

    # TODO: Initialize priority queue

    # TODO: Initialize a visited dictionary

    # TODO: Initialize counters to count number of visited nodes and evaluated edges

    while priority_queue:
        # TODO: Get the vertex with the smallest distance

        # TODO: Process the current vertex

        # TODO: Iterate over all neighbors of current vertex
            # TODO: For each neighbor, iterate over the edges between curr and neighbor

    return visited, nodes_visited, edges_evaluated
Task 02: Path Reconstruction
Task 02-1: Description (0 pts.)
Constructing the Optimal Path from Dijkstra's
Now lets write a function to reconstruct our path from the output of our Dijkstra's function and print out:
- The number of nodes visited
- The number of edges evaluated
- The best path from Central Park to the Theisen-Floyd Estate
- The total travel time in minutes
Our Dijkstra's algorithm will only return the node numbers but we want to have the actual names in our travel itinerary. In order to get the name from our num_to_name_df we can use the df.loc function from pandas. This is one of the more important and useful functions in the library, but the syntax is a little tricky to use.
If we wanted to print out the name of node 0, we can do so with the following code:
print(num_to_name_df.loc[0, 'name'])
> Central Park
A more idyomatic function we could also use to achieve the same effect is df.at and it works similarly to df.loc.
The code for the df.at function is given below:
print(num_to_name_df.at[0, 'name'])
> Central Park
We index by the row index and then by the column name. Notice that instead of nesting square brackets, we only have a single set and put both row and column inside. If we didn't want to index by the names, we could instead use df.iloc which accesses the dataframe strictly based on index values. So if we wanted to print out Central Park using iloc we could write that as follows:
print(num_to_name_df.iloc[0, 0])
> Central Park
Notice that we use 0 here for the column index, as the node_id column that we set as the index column in the dataframe doesn't count when using iloc, and so 'name' is the first column, or the 0th index.
There is also a df.iat function which we could use as follows:
print(num_to_name_df.iat[0, 0])
> Central Park
Task 02-1: Code (0 pts.)
def print_best_path_to_estate(visited, num_to_name_df, edges_df, start, destination):
    f"""
    Prints the best path from the start node to the destination node with transport modes and times,
    without repeating node names.

    Args:
    - visited: Dictionary mapping from node_num to (prev_num, total_cost)
    - edges_df: DataFrame with columns [src, dst, taxi_min, train_min, ferry_min, plane_min].
    - nodes_lookup: Series mapping node_id -> name.
    - start: The start node number.
    - destination: The destination node number.
    """
    mode_names = ["TAXI", "TRAIN", "FERRY", "FLIGHT"]

    # TODO: Get the best path from start to destination

    path = []
    curr = destination

    while curr != start:
        # TODO: Get the node we came from and the travel time to our current node

        # TODO: Calculate how much time we spent traveling between curr and prev based on how long it took to get to both overall

        # TODO: Based on how long it took between curr and prev, reverse engineer the mode of transport used

        path.append(f" ---[{mode}, {time} min]--> {num_to_name_df.loc[curr, 'name']}")

        # TODO: Snake backwards through our visited dictionary

    path.append(num_to_name_df.loc[curr, 'name'])

    # Join the path segments and print the result
    print(f"Best path from {num_to_name_df.loc[start, 'name']} to {num_to_name_df.loc[destination, 'name']}:")
    print(''.join(reversed(path)))
    print(f"Total travel time: {visited[destination][1]} minutes")
start_node = 0     # Central Park

visited, nodes_visited, edges_evaluated = dijkstra_multi_mode(edges_df, start_node)
print(f"Number of nodes visited: {nodes_visited}")
print(f"Number of edges evaluated: {edges_evaluated}")

print_best_path_to_estate(visited, num_to_name_df, edges_df, start=0, destination=13)
Task 02-2: Expected Output (1 pt.)
Number of nodes visited: 14
Number of edges evaluated: 25
Best path from Central Park to William Theisen-Floyd Estate:
Central Park ---[TAXI, 8 min]--> Grand Central Station ---[TAXI, 16 min]--> LGA ---[FLIGHT, 35 min]--> KISP ---[TAXI, 13 min]--> Patchogue ---[TAXI, 23 min]--> William Theisen-Floyd Estate
Total travel time: 95 minutes
Story Progression

Nice! You have a path that should get you to the Theisen-Floyd Estate as quickly as possible! It's time to submit your travel itinerary to the police, but you can't help but wonder if you could have done better if you'd been given some heuristic estimates...
Task 03: Police Report Generation
Task 03-1: Description (0 pts.)
Exporting Notebook to HTML
Run the code cell below and it should automatically export and download an html version of your notebook, which you can submit to the Chief via Canvas!
Task 03-1: Code (0 pts.)
import os, json

ASS_PATH = "nd-cse-30124-homeworks/labs"
ASS = "lab00"

try:
    from google.colab import _message, files

    # where you WANT it to live (repo folder)
    repo_ipynb_path = f"/content/{ASS_PATH}/{ASS}.ipynb"

    # grab current notebook contents from the UI
    nb = _message.blocking_request("get_ipynb", timeout_sec=1)["ipynb"]

    # write it into the repo folder as a real file
    os.makedirs(os.path.dirname(repo_ipynb_path), exist_ok=True)
    with open(repo_ipynb_path, "w", encoding="utf-8") as f:
        json.dump(nb, f)

    # convert + download html
    !jupyter nbconvert --to html "{repo_ipynb_path}"
    files.download(repo_ipynb_path.replace(".ipynb", ".html"))
except:
    import subprocess

    nb_fp = os.getcwd() + f'{ASS}.ipynb'
    print(os.getcwd())

    subprocess.run(["jupyter", "nbconvert", "--to", "html", nb_fp], check=True)