CSE 30124 - Introduction to Artificial Intelligence: Lab 01 (5 pts.)
- NETID:
This assignment covers the following topics:
- Data cleaning and splitting messy pandas datasets
- Creating "features" from raw data (feature engineering)
- Expert Systems / Rule-based Classification
- An introduction to sklearn via kNNs
It will consist of 5 tasks:
| Task ID | Description | Points |
|---|---|---|
| 00 | Load and Split Dataset | 1 |
| 00-1 | - Load Dataset | |
| 00-2 | - Explore the Data | |
| 00-3 | - Split into Training and Testing DataFrames | |
| 01 | Creating Features | 2 |
| 01-1 | - Create Weapon Keyword Feature | |
| 01-2 | - Create Average Lying Probability Feature | |
| 01-3 | - Prepare Feature Data | |
| 02 | Expert System / Rule-Based Classification | 0 |
| 02-1 | - Test Expert System | |
| 03 | Creating and Using kNN | 1 |
| 03-1 | - Create kNN | |
| 03-2 | - Use kNN | |
| 04 | Retrieve Suspect Statements | 1 |
| 05 | Generate Police Report | 0 |
Please complete all sections. Some questions will require written answers, while others will involve coding. Be sure to run your code cells to verify your solutions.
Story Progression
As you finish your drink, you feel a tap on your shoulder. You respond with:
"You've got the wrong guy pal"
but as you look back, you realize it's a police officer. His name badge says Officer Gaff. He tells you to come with him and so you hop in his car and he drives you back to the precinct, where you're introduced to a director Bryant. It seems your job isn't over quite yet.
Director Bryant tells you that they've collected a list of 20 suspects and they've had them take a polygraph test to see if they can narrow it down at all.

For each of the 20 suspects, the police asked them 10 questions and recorded the polygraph results for each question, resulting in the following data:
name,statement_1throughstatement_10,lying_prob_1throughlying_prob_10
In addition to the 20 suspects they've had take a polygraph test, they have 60 examples of good suspects from prior cases, but unfortunately for these examples the data is in an entirely different format:
name,weapon_mentions,total_lying_prob,good_suspect
Director Bryant tells you that the intern they hired to do the data processing just offloaded it to Gemini and all of the data got mixed together into one evidence file called suspect_data.csv and it has been giving them fits. He heard about your success with the travel itinerary last week and is hoping you can help!
Task 00: Load and Split Dataset (1 pt.)
Task 00-1: Load Dataset (0 pts.)
Loading the Dataset
Run the cell below to download the evidence, load suspect_data.csv into a dataframe and print out the first five rows.
Task 00-1: Code (0 pts.)
import os
import pandas as pd

try:
    import google.colab
    REPO_URL = "https://github.com/wtheisen/nd-cse-30124-homeworks.git"

    REPO_PATH = "/content/nd-cse-30124-homeworks"
    L_PATH = "nd-cse-30124-homeworks/evidence/lab01"

    %cd /content/
    !rm -rf {REPO_PATH}

    # Clone repo
    if not os.path.exists(REPO_PATH):
        !git clone {REPO_URL}

        # cd into the data folder
        %cd {L_PATH}
        !pwd

except ImportError:
    print("Unable to download repo, either:")
    print("\tA.) You're not on colab")
    print("\tB.) It has already been cloned")

# TODO: Load the dataset via pandas

# TODO: Print the first 5 rows of the dataframe
Task 00-1: Expected Output (0 pts.)
suspect_name	weapon_mentions	total_lying_prob	good_suspect	statement_1	statement_2	statement_3	statement_4	statement_5	statement_6	...	lying_prob_1	lying_prob_2	lying_prob_3	lying_prob_4	lying_prob_5	lying_prob_6	lying_prob_7	lying_prob_8	lying_prob_9	lying_prob_10
0	Olivia Zino	NaN	NaN	NaN	I arrived late to the party	Someone was carrying a bag upstairs	I heard arguing in the study	The buffet in the kitchen looked incomplete	I stayed near the entrance	Someone mentioned a knife was missing	...	0.50	0.52	0.49	0.51	0.50	0.52	0.49	0.51	0.50	0.51
1	Claudia Huck	3.0	0.77	1.0	NaN	NaN	NaN	NaN	NaN	NaN	...	NaN	NaN	NaN	NaN	NaN	NaN	NaN	NaN	NaN	NaN
2	Everton Albuquerque de Oliveira	4.0	0.85	1.0	NaN	NaN	NaN	NaN	NaN	NaN	...	NaN	NaN	NaN	NaN	NaN	NaN	NaN	NaN	NaN	NaN
3	Cameron Rohlfsen	NaN	NaN	NaN	I arrived alone	I mingled with guests	The host mentioned a knife collection	I stayed in common areas	I left at midnight	Nothing caught my eye	...	0.54	0.53	0.55	0.54	0.53	0.55	0.54	0.53	0.54	0.55
4	Samuel Gisiner	3.0	0.86	1.0	NaN	NaN	NaN	NaN	NaN	NaN	...	NaN	NaN	NaN	NaN	NaN	NaN	NaN	NaN	NaN	NaN
Note: Your editor will hopefully format the dataframe rows nicely for you
Task 00-2: Description (0 pts.)
Splitting the Dataset
Using pandas, separate the singular dataframe into two new dataframes, one containing the 60 suspect examples from prior cases, where good_suspect is set to either 0 or 1 and the results of the interviews from the 20 suspects for the current case (those where good_suspect is NaN). Given below are some useful functions in pandas that you may be able to use to help you!
Checking for missing values:
# Count NaN values in each column
df.isna().sum()

# Check if a specific column has NaN values
df['column_name'].isna()  # Returns True/False for each row

# Filter to rows where a column is NOT NaN
df[df['column_name'].notna()]
Understanding the data types:
df.info()  # Shows data type and non-null count for each column
df.dtypes  # Just shows data types
Filtering Dataframes on Conditionals
# Basic filtering
adults = df[df['age'] >= 18]           # Rows where age is 18+
students = df[df['role'] == 'student'] # Rows where role is 'student'

# Filtering by NaN values
has_email = df[df['email'].notna()]    # Rows where email is NOT NaN
no_email = df[df['email'].isna()]      # Rows where email IS NaN

# Multiple conditions (use & for AND, | for OR)
young_students = df[(df['age'] < 25) & (df['role'] == 'student')]
Important: When using multiple conditions, wrap each condition in parentheses!
Task 00-2: Code (0 pts.)
# TODO: Split the data based on whether good_suspect is filled in

print(f"Training samples: {len(training_df)}")
print(f"Testing samples: {len(testing_df)}")
print(f"Total: {len(training_df) + len(testing_df)}")
Task 00-2: Expected Output
Training samples: 60
Testing samples: 20
Total: 80
Story Progression
You can't believe the Police had the training and testing data mixed together in the same file, Professor Theisen would have killed you. I guess that's what you get when some intern blindly uses AI. Fortunately, you figured out how to separate them and now you can see that:
- Training data (60 records): Has
weapon_mentions,total_lying_prob, andgood_suspect(the label) - Testing data (20 records): Has raw
statement_1throughstatement_10andlying_prob_1throughlying_prob_10
Unfortunately, the testing data format doesn't match the training data format. You'll need to do some feature engineering to transform the raw testing data into the same format as the training data!
Feature engineering is the process of transforming raw data into meaningful numerical values ("features") that machine learning algorithms can use. It's often said that feature engineering is the most important part of machine learning - good features can make a simple algorithm work great, while bad features will make even sophisticated algorithms fail.
We'll need to create two features from the raw polygraph data in order to match our examples:
weapon_mentions(count feature): How many times weapon-related keywords appear in the suspect's statementstotal_lying_prob(aggregate feature): The average lying probability across all statements
Task 01: Create Features from Testing Data to Match Training Data (2 pts.)
Task 01-1: Description (0 pts.)
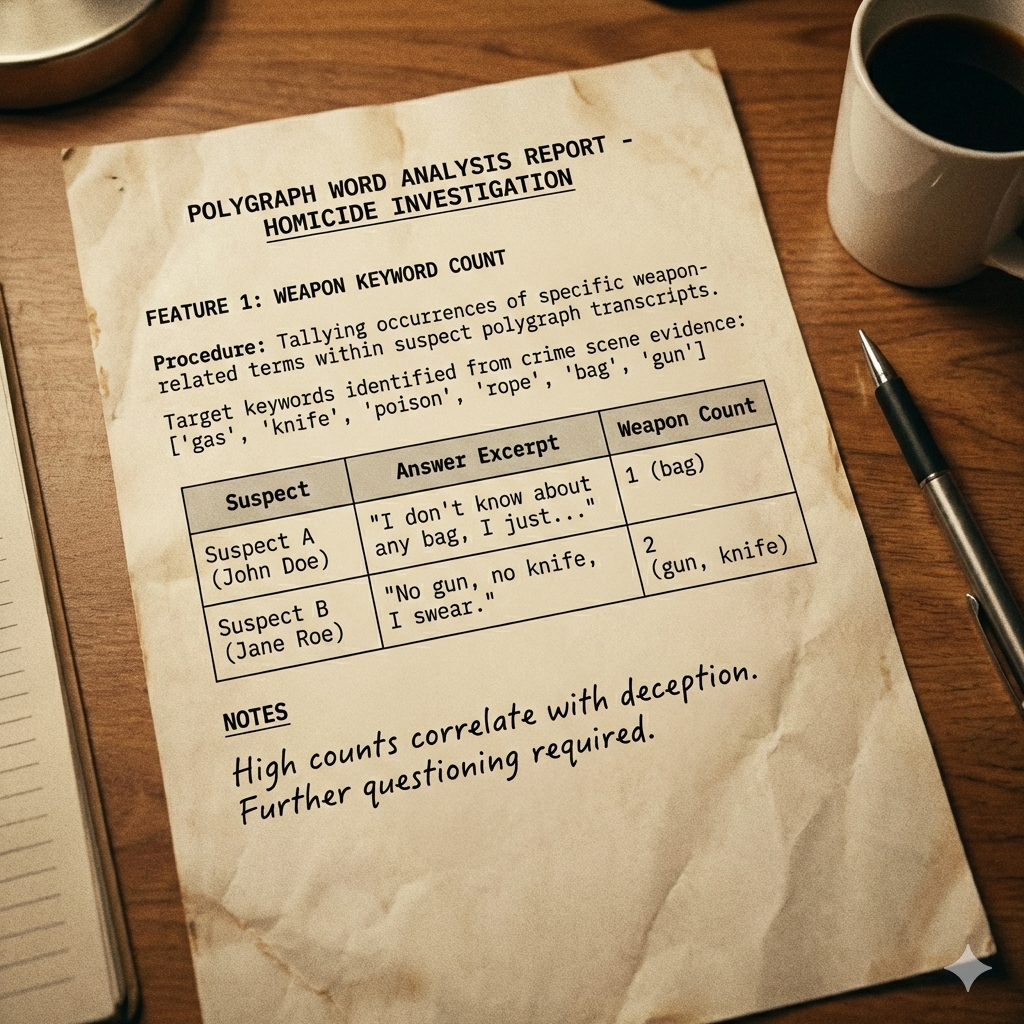
Creating the Weapon Mention Feature
Our first feature counts how many times weapon-related keywords appear in a suspects answers to the polygraph. The weapons we're looking for are
weapons = ['gas', 'knife', 'poison', 'rope', 'bag', 'gun']
which were the weapons identified by the Police at the scene of the crime in homework01
Useful String Operations in Pandas
# Convert to lowercase (important for matching!)
text = "I saw a KNIFE"
text.lower()  # Returns: "i saw a knife"

# Count occurrences of a substring
text = "the knife was a sharp knife"
text.count('knife')  # Returns: 2

# Join multiple strings together
statements = ["I was home", "I saw nothing", "I left early"]
combined = ' '.join(statements)  # "I was home I saw nothing I left early"
Using df.apply() to Process Each Row
When you need to apply a custom function to each row of a DataFrame, use df.apply() with axis=1:
def my_function(row):
    # row is a pandas Series representing one row
    # You can access columns like: row['column_name']
    return some_value

# Apply to each row and create a new column
df['new_column'] = df.apply(my_function, axis=1)

# Or use a lambda (anonymous function) for simple operations
df['new_column'] = df.apply(lambda row: row['a'] + row['b'], axis=1)
in the cell below, finish the count_weapon_mentions function to get the weapon mention counts from a suspects polygraph answers.
Task 01-1: Code (1 pt.)
weapons = ['gas', 'knife', 'poison', 'rope', 'bag', 'gun']

def count_weapon_mentions(row, weapons):
    """
    Count how many weapon keywords appear across all statements for a suspect.

    Args:
        row (pandas.Series): A pandas Series representing one suspect's data
        weapons (list): List of weapon keywords to search for

    Returns:
        weapon_count (int): Total count of weapon mentions
    """
    count = 0

    # TODO: Get all statement columns (statement_1, statement_2, ..., statement_10)

    # TODO: Combine all statements into one text block

    # TODO: Count each weapon keyword

    return count

# TODO: Apply to testing data using df.apply() with axis=1 (apply to each row)

print("Weapon mentions per suspect:")
print(testing_df[['suspect_name', 'weapon_mentions']].head(10))
Task 01-1: Expected Output (1 pt.)
Weapon mentions per suspect:
        suspect_name  weapon_mentions
0        Olivia Zino                2
3   Cameron Rohlfsen                1
9       Liam Sagucio                1
14    Olivia Pierret                0
16        Ryan Putka                0
18   Logan St Pierre                0
22     Jack Mangione                6
26        Tom Lohman                6
32        Conor Zech                0
37     Madelyn Perez                1
Task 01-2: Description (0 pts.)
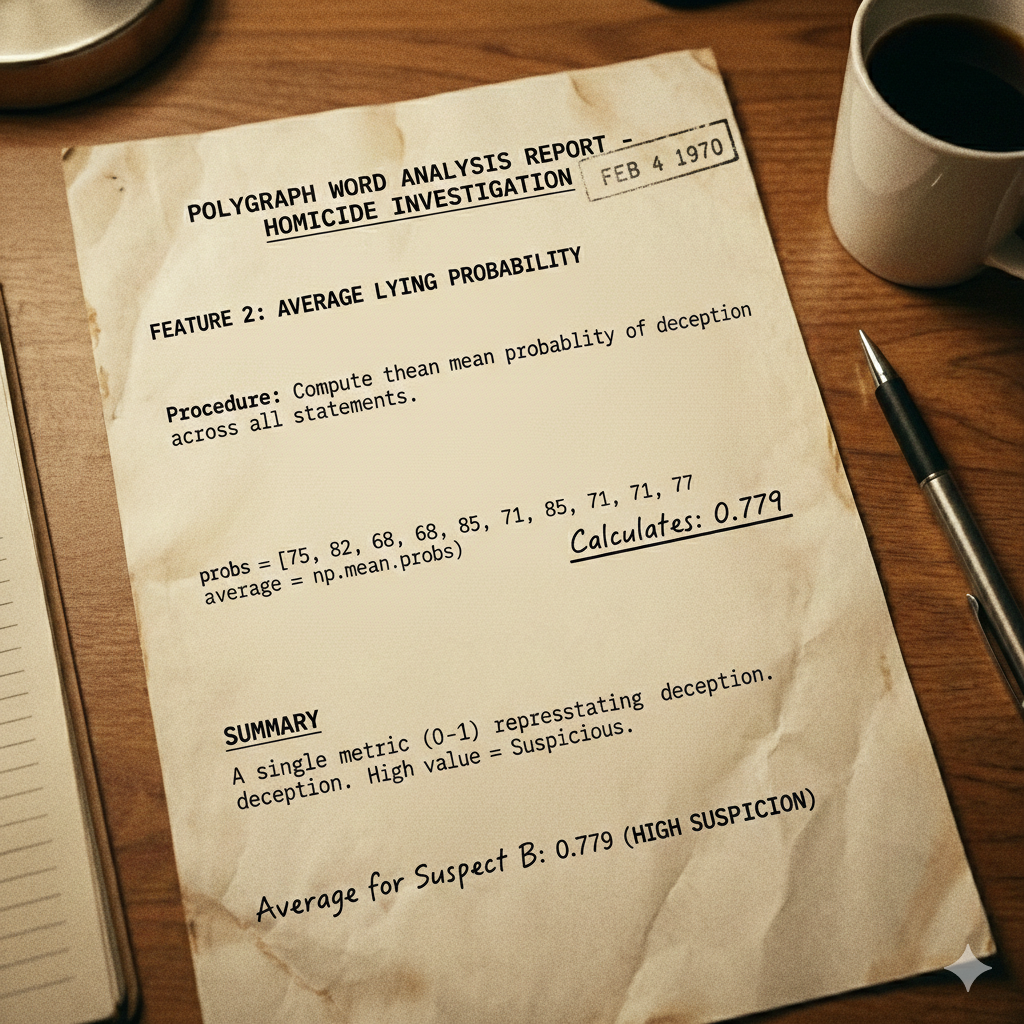
Creating the Average Lying Probability Feature
The other feature we were missing is the total_lying_prob. It seems reasonable that if someone has a high lying probability on multiple answers during the polygraph, they're more suspicious overall. We want a single number that captures their overall "suspiciousness."
Aggregation Methods
There are several ways to combine multiple values into one:
| Method | Function | When to use |
|---|---|---|
| Mean (average) | np.mean() |
When all values contribute equally |
| Sum | np.sum() |
When you want total amount |
| Max | np.max() |
When the highest value matters most |
| Min | np.min() |
When the lowest value matters most |
| Median | np.median() |
When you want to ignore outliers |
For our case:
Example Calculation
import numpy as np

# A suspect's lying probabilities for 10 statements
probs = [0.75, 0.82, 0.68, 0.79, 0.85, 0.71, 0.88, 0.73, 0.81, 0.77]

# Calculate average
average = np.mean(probs)  # Returns: 0.779
We'll use the mean (average) of all lying probabilities. This gives us a single value between 0 and 1 that represents how suspicious the suspect's polygraph answers were on average. In the cell below, finish the avg_lying_probs function to get the average lying probability for a suspect's polygraph answers
Task 01-2: Code (1 pt.)
import numpy as np

def avg_lying_probs(row):
    """
    Extract all lying probability values from a row and then calculate the average.

    Args:
        row (pandas.Series): A pandas Series representing one suspect's data

    Returns:
        avg (float): Average lying probability (between 0 and 1)
    """

    # TODO: Get all lying probability columns, we can use col.startswith to get them

    # TODO: Calculate the average of all lying probabilities

# TODO: Apply to testing data

print("Total lying probability (average) per suspect:")
print(testing_df[['suspect_name', 'total_lying_prob']].head(10))
Task 01-2: Expected Output (1 pt.)
Total lying probability (average) per suspect:
        suspect_name  total_lying_prob
0        Olivia Zino             0.505
3   Cameron Rohlfsen             0.540
9       Liam Sagucio             0.540
14    Olivia Pierret             0.175
16        Ryan Putka             0.175
18   Logan St Pierre             0.175
22     Jack Mangione             0.784
26        Tom Lohman             0.783
32        Conor Zech             0.177
37     Madelyn Perez             0.537
Task 01-3: Description (0 pts.)
Prepare Feature Matrix for Machine Learning
Now that we've created our features, we need to convert the data into the format that our classication models can use.
sklearn's Data Format
All sklearn algorithms expect data in a specific format:
| Variable | Shape | Description | Example |
|---|---|---|---|
| X | (n_samples, n_features) | Feature matrix | [[4, 0.85], [0, 0.12], [3, 0.78]] |
| y | (n_samples,) | Target labels | [1, 0, 1] |
- X is a 2D array where each row is one sample (suspect) and each column is one feature
- y is a 1D array of labels (what we're trying to predict)
Converting DataFrame to NumPy Array
# Select specific columns and convert to numpy array
X = df[['feature1', 'feature2']].values  # .values converts to numpy array

# Get labels
y = df['label_column'].values
Task 01-3: Code (0 pts.)
# TODO: Prepare testing features to match training format

# TODO: Training data already has features and labels
Story Progression
Great, now we have features that match! The testing data now has the same format as the training data:
weapon_mentions: Count of weapon keywords in statementstotal_lying_prob: Average lying probability across all statements
Task 02: Expert System / Rule-Based Classification (0 pts.)
Task 02-1: Description (0 pts.)
What is an Expert System?
An expert system is a computer program that encodes human expert knowledge as explicit rules. It's one of the oldest approaches to AI, dating back to the 1970s.
How Expert Systems Work
Expert systems use if-then rules based on domain knowledge:
# Medical diagnosis expert system (simplified)
if fever > 101 and cough and fatigue:
    diagnosis = "flu"
elif fever > 101 and rash:
    diagnosis = "measles"
elif headache and stiff_neck and fever:
    diagnosis = "meningitis"
else:
    diagnosis = "unknown"
Expert Systems vs Machine Learning
| Aspect | Expert Systems | Machine Learning |
|---|---|---|
| Knowledge source | Human experts write rules | Algorithm learns from data |
| Interpretability | High - you can trace exactly why | Often low - "black box" |
| Training data needed | None | Usually lots |
| Handles edge cases | Poorly - only handles coded rules | Better - generalizes patterns |
| Maintenance | Hard - rules become complex | Easy - just retrain with new data |
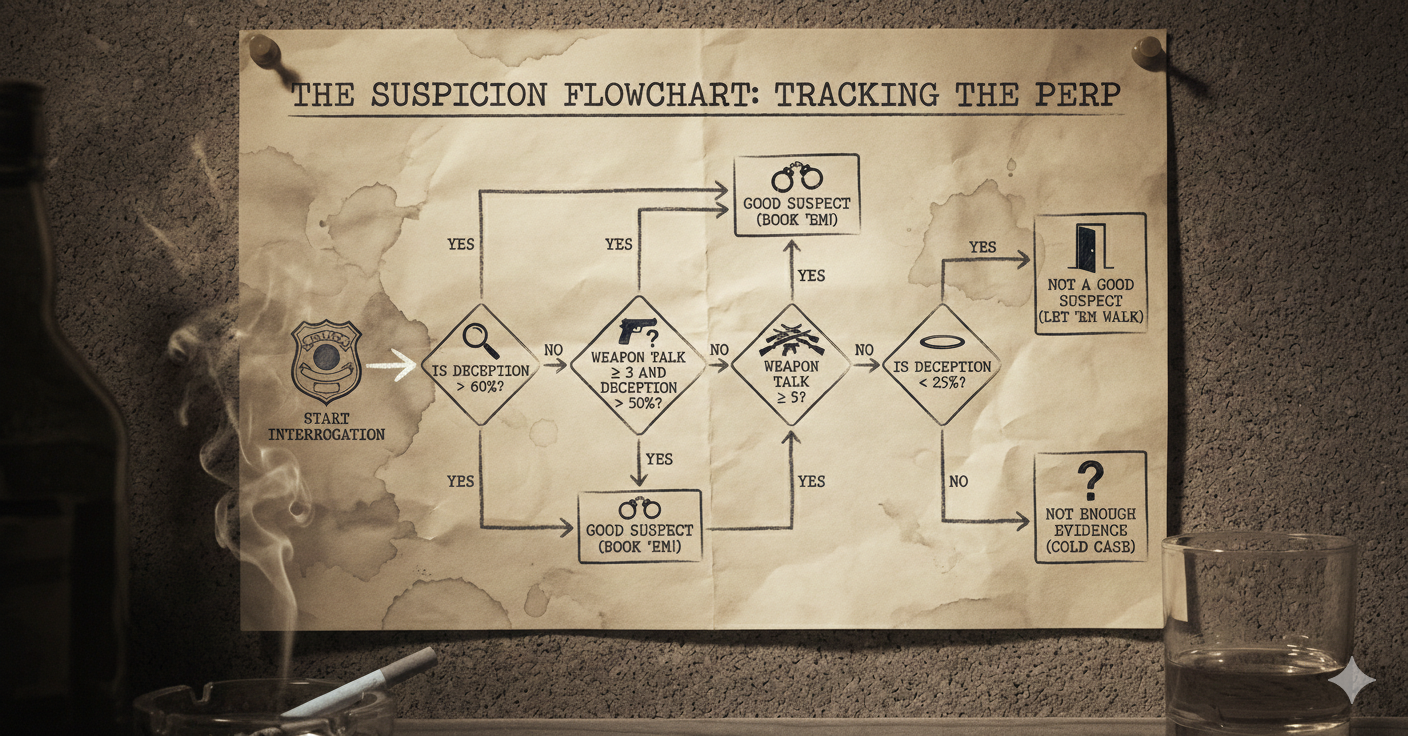
Expert Police Suspect System Rules
- High lying probability (> 60%) → Suspicious
- Multiple weapons (≥ 3) AND moderate lying (> 50%) → Suspicious
- Many weapons (≥ 5) → Suspicious (regardless of lying probability)
- Very low lying probability (< 25%) → Probably innocent
Task 02-1: Code (0 pts.)
def expert_classify_suspect(weapon_mentions, lying_prob):
    """
    Rule-based expert system for classifying suspects.
    Rules derived from "domain expert" knowledge about polygraph analysis.

    Args:
        weapon_mentions: Number of weapon keywords in statements
        lying_prob: Average lying probability across all statements (0-1)

    Returns:
        1 if suspect is worth investigating ("good suspect")
        0 otherwise
    """
    # Rule 1: High average lying probability is very suspicious
    if lying_prob > 0.6:
        return 1  # Good suspect

    # Rule 2: Multiple weapon mentions combined with moderate lying
    if weapon_mentions >= 3 and lying_prob > 0.5:
        return 1  # Good suspect

    # Rule 3: Many weapon mentions is suspicious regardless
    if weapon_mentions >= 5:
        return 1  # Good suspect

    # Rule 4: Very low lying probability - probably innocent
    if lying_prob < 0.25:
        return 0  # Not a good suspect

    # Default: not enough evidence
    return 0

# TODO: Apply expert system to testing data

# See who the expert system flags
expert_suspects = testing_df[testing_df['expert_prediction'] == 1]
print(f"Expert system identified {len(expert_suspects)} suspects:")
print(expert_suspects[['suspect_name', 'weapon_mentions', 'total_lying_prob']].to_string())
Task 02-1: Expected Output (0 pts.)
Expert system identified 4 suspects:
     suspect_name  weapon_mentions  total_lying_prob
21  Jack Mangione                6             0.784
25     Tom Lohman                6             0.783
65  Sophia Noonan                4             0.575
76   Claire Green                4             0.779
Story Progression
Well that doesn't seem right, the Police had pretty explicitly identified 6 suspects at the scene of the crime: Mr. Green, Professor Plum, Colonel Mustard, Mrs. White, Mrs. Peacock, and Miss Scarlet.
This boomer, out-of-date expert system only found four! It may be time to try something on your own. As you're sneaking a quaff of your flask it hits you, you could try using a k-Nearest Neighbors model to see if that gives you anything better than this dumb flowchart system. Luckily for you, most common ML algorithms can be accessed through a library called sklearn.
What is sklearn?
Scikit-learn (sklearn) is Python's most popular machine learning library. It provides:
- Dozens of ML algorithms (kNN, Decision Trees, SVM, etc.)
- Tools for preprocessing, evaluation, and model selection
- A consistent API across all algorithms
sklearn's Consistent API
One of sklearn's best features is its consistent API. All classifiers follow the same pattern:
from sklearn.neighbors import KNeighborsClassifier

# Step 1: Create the model
model = KNeighborsClassifier(n_neighbors=N)

# Step 2: Train on data
model.fit(X_train, y_train)

# Step 3: Make predictions
predictions = model.predict(X_test)
Note: If one were to be asked to use a Decision Tree at some point cough, cough it's possible that it would look very similar
Task 03: Use kNN to Find the Suspects (1 pt.)
Task 03-1: Description (0 pts.)
What is k-Nearest Neighbors (kNN)?
In the cell below, create and fit a kNN classifier from sklearn
Task 03-1: Code (0 pts.)
from sklearn.neighbors import KNeighborsClassifier

# TODO: Create kNN classifier for k = 3

# TODO: Fit on training data

print(f"Number of training samples: {len(X_train)}")
print(f"Number of neighbors (k): {knn.n_neighbors}")
Task 03-1: Expected Output (0 pts.)
Number of training samples: 60
Number of neighbors (k): 3
Task 03-2: Description (0 pts.)
Using kNN to Make Predictions
Now let's use our trained kNN to classify our suspects.
Key methods:
predict(X): Returns the predicted class (0 or 1) for each sample
Task 03-2: Code (0 pts.)
# TODO: Predict which suspects are "good suspects"

# TODO: Add predictions back to dataframe

# TODO: Filter to good suspects, those with knn_prediction == 1

print(f"kNN (k=3) identified {len(knn_suspects)} suspects to investigate further:")
print(knn_suspects[['suspect_name', 'weapon_mentions', 'total_lying_prob', 'knn_prediction']].to_string())
Task 03-2: Expected Output (0 pts.)
kNN (k=3) identified 6 suspects to investigate further:
        suspect_name  weapon_mentions  total_lying_prob  knn_prediction
3   Cameron Rohlfsen                1             0.540             1.0
9       Liam Sagucio                1             0.540             1.0
22     Jack Mangione                6             0.784             1.0
26        Tom Lohman                6             0.783             1.0
37     Madelyn Perez                1             0.537             1.0
76      Claire Green                4             0.779             1.0
Story Progression
Hmmmmmmm that's odd, you could have swore that several of these suspects had alibis for the night of the murder. You know for sure at least that Cameron was rocking the cheer squad at a basketball game that very night. Something must have gone wrong. You wonder if a different value for k might effect the results. It may be worth trying some different hyperparameters. A hyperparameter is a value you choose before training that affects how the model behaves. Unlike regular parameters (which are learned from data), hyperparameters are set by you.
Examples of Hyperparameters
| Algorithm | Hyperparameter | What it controls |
|---|---|---|
| kNN | n_neighbors (k) |
How many neighbors to consider |
| Decision Tree | max_depth |
How deep the tree can grow |
| Neural Network | learning_rate |
How fast to update weights |
The Effect of k in kNN
Small k (e.g., 1 or 3):
- More sensitive to local patterns
- Can be influenced by noise/outliers
- May overfit
Large k (e.g., 10 or 20):
- More robust to noise
- Smoother decision boundaries
- May underfit (miss local patterns)
Task 03-3: Description (0 pts.)
Hyperparameter Tuning
In the cell below try the following values of k:
[1, 3, 5, 7, 9]
to see if you can match the expected output of:
6 suspects - ['Olivia Zino', 'Jack Mangione', 'Tom Lohman', 'Cesar Cervera', 'Sophia Noonan', 'Claire Green']
Remember that we typically use odd numbers for k so we don't end up with a tie during the vote!

Task 03-3: Code (0 pts.)
for k in [1, 3, 5, 7, 9]:
    # TODO: Try the different values of k listed above

    print(f"{len(knn_suspects)} suspects - {knn_suspects['suspect_name'].tolist()}")
Task 03-3: Expected Output (1 pt.)
6 suspects - ['Cameron Rohlfsen', 'Liam Sagucio', 'Jack Mangione', 'Tom Lohman', 'Madelyn Perez', 'Claire Green']
6 suspects - ['Cameron Rohlfsen', 'Liam Sagucio', 'Jack Mangione', 'Tom Lohman', 'Madelyn Perez', 'Claire Green']
6 suspects - ['Olivia Zino', 'Jack Mangione', 'Tom Lohman', 'Cesar Cervera', 'Sophia Noonan', 'Claire Green']
6 suspects - ['Olivia Zino', 'Jack Mangione', 'Tom Lohman', 'Cesar Cervera', 'Sophia Noonan', 'Claire Green']
6 suspects - ['Olivia Zino', 'Jack Mangione', 'Tom Lohman', 'Cesar Cervera', 'Sophia Noonan', 'Claire Green']
Story Progression
Wow, depending on what you choose for k you get different suspects! You hope the police don't bring in anyone innocent. Just to be sure, you decide to leave the names that changed to the police, but you also notice that there were a few names that were there the entire time:
- Claire Green
- Tom Lohman
- Jack Mangione
These three must be really suspicious. It may be worth paying a couple of them a visit on your own time...
Task 04: Collecting Suspect Statements (1 pt.)
Task 04: Description (0 pts.)
Visit the following two suspects to collect their statements about the night of the murder. You'll need this data to complete homework02 so only one team member needs to visit each suspect, feel free to divide up the work. The available times to pick up the suspects (TAs) statements are listed below:
- Jack Mangione: 5:00 - 7:00 on Monday and Wednesday in the CSE Commons
- Claire Green: 6:00 - 7:30 Tuesday and 6:00 - 8:00 Thursday at Hagerty Cafe
Note: You'll need this data to complete homework02 though most of you won't actually read this part and will leave it until an hour before homework02 and be mad at me (the TAs are super cool and flexible so if you genuinely cannot find time in the next month to make it to one of their OH times please just reach out to them!)
Task 05: Generate Police Report
Task 05: Description (0 pts.)
Run the code cell below to generate a report for the Police and submit it on Canvas!
Task 05: Code (0 pts.)
import os, json

ASS_PATH = "nd-cse-30124-homeworks/labs"
ASS = "lab01"

try:
    from google.colab import _message, files

    # where you WANT it to live (repo folder)
    repo_ipynb_path = f"/content/{ASS_PATH}/{ASS}/{ASS}.ipynb"

    # grab current notebook contents from the UI
    nb = _message.blocking_request("get_ipynb", timeout_sec=1)["ipynb"]

    # write it into the repo folder as a real file
    os.makedirs(os.path.dirname(repo_ipynb_path), exist_ok=True)
    with open(repo_ipynb_path, "w", encoding="utf-8") as f:
        json.dump(nb, f)

    # convert + download html
    !jupyter nbconvert --to html "{repo_ipynb_path}"
    files.download(repo_ipynb_path.replace(".ipynb", ".html"))
except:
    import subprocess

    nb_fp = os.getcwd() + f'/{ASS}.ipynb'
    print(os.getcwd())

    subprocess.run(["jupyter", "nbconvert", "--to", "html", nb_fp], check=True)
finally:
    print('[WARNING]: Unable to export notebook as .html')